
What is visualization?
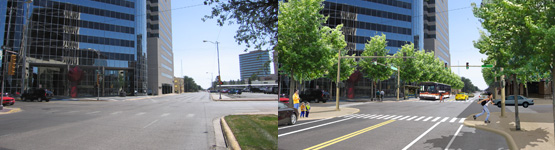
Visualization is the process of taking abstract ideas or data and translating them into easily understood and easily interpreted images and graphics. Visual aids can illustrate plans for the future or difficult-to-understand, especially during planning, urban design, and decision-making processes. Visualization techniques can be simple drawings, charts, and maps, or elaborate photomontages, three-dimensional visualization, and visual preference techniques. Visualization techniques are part of a broader suite of tools for community design and decision-making that help communities make better plans for the future by ensuring the integration of good data, comprehensive analysis, and strong civic engagement processes.
Who can implement it?
Visualization is a strategy that can be used by all agencies and can be applied at a variety of scales, from small, site specific projects to regional areas. In addition to motivating the public to become involved in the future of their community, visualization tools and techniques can be used to educate the public about planning concepts, such as presenting and evaluating development impact on vacant lots, assessing congestion and available capacity on a transportation corridor, or choosing the appropriate trees and lampposts on a city street.
What are the keys to success and potential pitfalls?
Visualization tools draw people into a planning process and provide a venue for immediate feedback on the quality and appeal of different design choices. Visualization tools and techniques are commonly used in the early stages of a community development design process, to help identify a community vision, educate the public about a specific design concept, and obtain feedback on planning and design alternatives. Visualization is also valuable at other stages of the planning process, from engaging stakeholders to assessing impacts. It can be used to present a final plan to a design review board, or sell a concept to investors or developers. The most powerful visualization tools show what the built environment might look like under different design and development scenarios over time, helping to overcome communication difficulties caused by the use of planning jargon and technical terms.
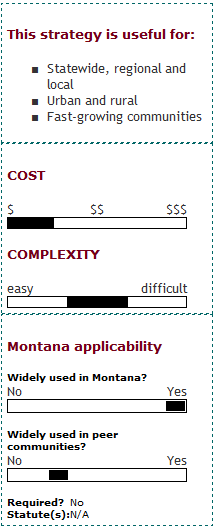
While visualization can be conducted effectively for low cost, some visualization techniques and tools can be time consuming and expensive to implement. It is important to ensure that the techniques chosen are appropriate within the context of the overall goals and budget of the project. A community's particular character, issues, and processes should be the driving forces to determine what particular tools will be used. For example, a time-sequenced photomontage may not be appropriate for a small community with little expected growth during their comprehensive plan update; but a better tool may be a map showing the projected population growth in 20 years.
The influence of the mass media leads the public to have high expectations for the quality of images. People may dismiss visual content if they perceive the quality is not comparable with their expectations. Conversely detailed and sophisticated images, such as those using a photomontage, can raise false expectations about how an area will change.
One challenge with visualization is finding ways to express complex ideas in an easily understandable graphic. It is important to take the bias out of photographs whenever possible to ensure that people are voting on the design elements being discussed and are not being influenced by other factors, such as weather conditions. Give attention to the language so that wording does not influence results.
Where has this strategy been applied?
Examples in Montana
- Montana Department of Transportation (MDT) uses a variety of visualization techniques in their public involvement process to help illustrate and explain concepts and information related to statewide planning, corridor planning, and programming. MDT uses visualization tools such as maps, graphs, charts, drawings, pictures, flow charts, and other data to support a variety of public and stakeholder outreach activities, plans, and projects. This information is largely conveyed using electronic methods, including the MDT web site, specific links to statewide plan and corridor project web sites, as well as hard copy and electronic presentation material.
- The City of Helena conducted a visual preference survey to determine what the citizens of Helena want the City to look like as it grows and develops. Picture Helena! was a successful effort to get residents involved in the process of updating zoning regulations and was a useful tool for creating awareness and soliciting participation in the process. The results of the visual preference survey were used in developing several chapters of the City's zoning regulations.
Examples outside of Montana
- Community Visioning (Connecticut)
The Hartford Metropolitan Planning Organization (MPO) and Town of Suffield in Connecticut employed a number of public involvement tools to help a growing rural community identify and implement zoning changes, transportation improvements, and other policies to preserve community character while accommodating growth. The public involvement process was funded by a Federal Highway Administration (FHWA) grant to the Capitol Regional Council of Governments (CRCOG). Public involvement efforts included the use of the following:- Regional opinion survey,
- Visual preference survey, and
- Community visioning workshop.
Case studies
- Missoula Urban Fringe Development Area (UFDA) Project, MT
- PlanCheyenne, WY
- Eastern Planning Initiative (EPI), VA
How can I get started?
Existing data is necessary for any sort of visualization. It is recommended that a well-organized photo library be accessible. When developing any sort of document or preparing for a meeting where visual aids may help, brainstorming ideas about what information and ideas need to be conveyed is crucial. Designing these materials with several perspectives in mind will help ensure that the visual aids communicate the message efficiently and accurately.