Many factors influence the utilization of external professional services for transportation projects. Some of these factors are: federal and state highway funding levels; internal MDT staff availability; and complexity/expertise requirements. As a result, the percentage of work that is done by consultant firms ebbs and flows from year to year.
The following graphs contain recent historical data regarding the use of consultant services at the Montana Department of Transportation.
Consultant Expenditures
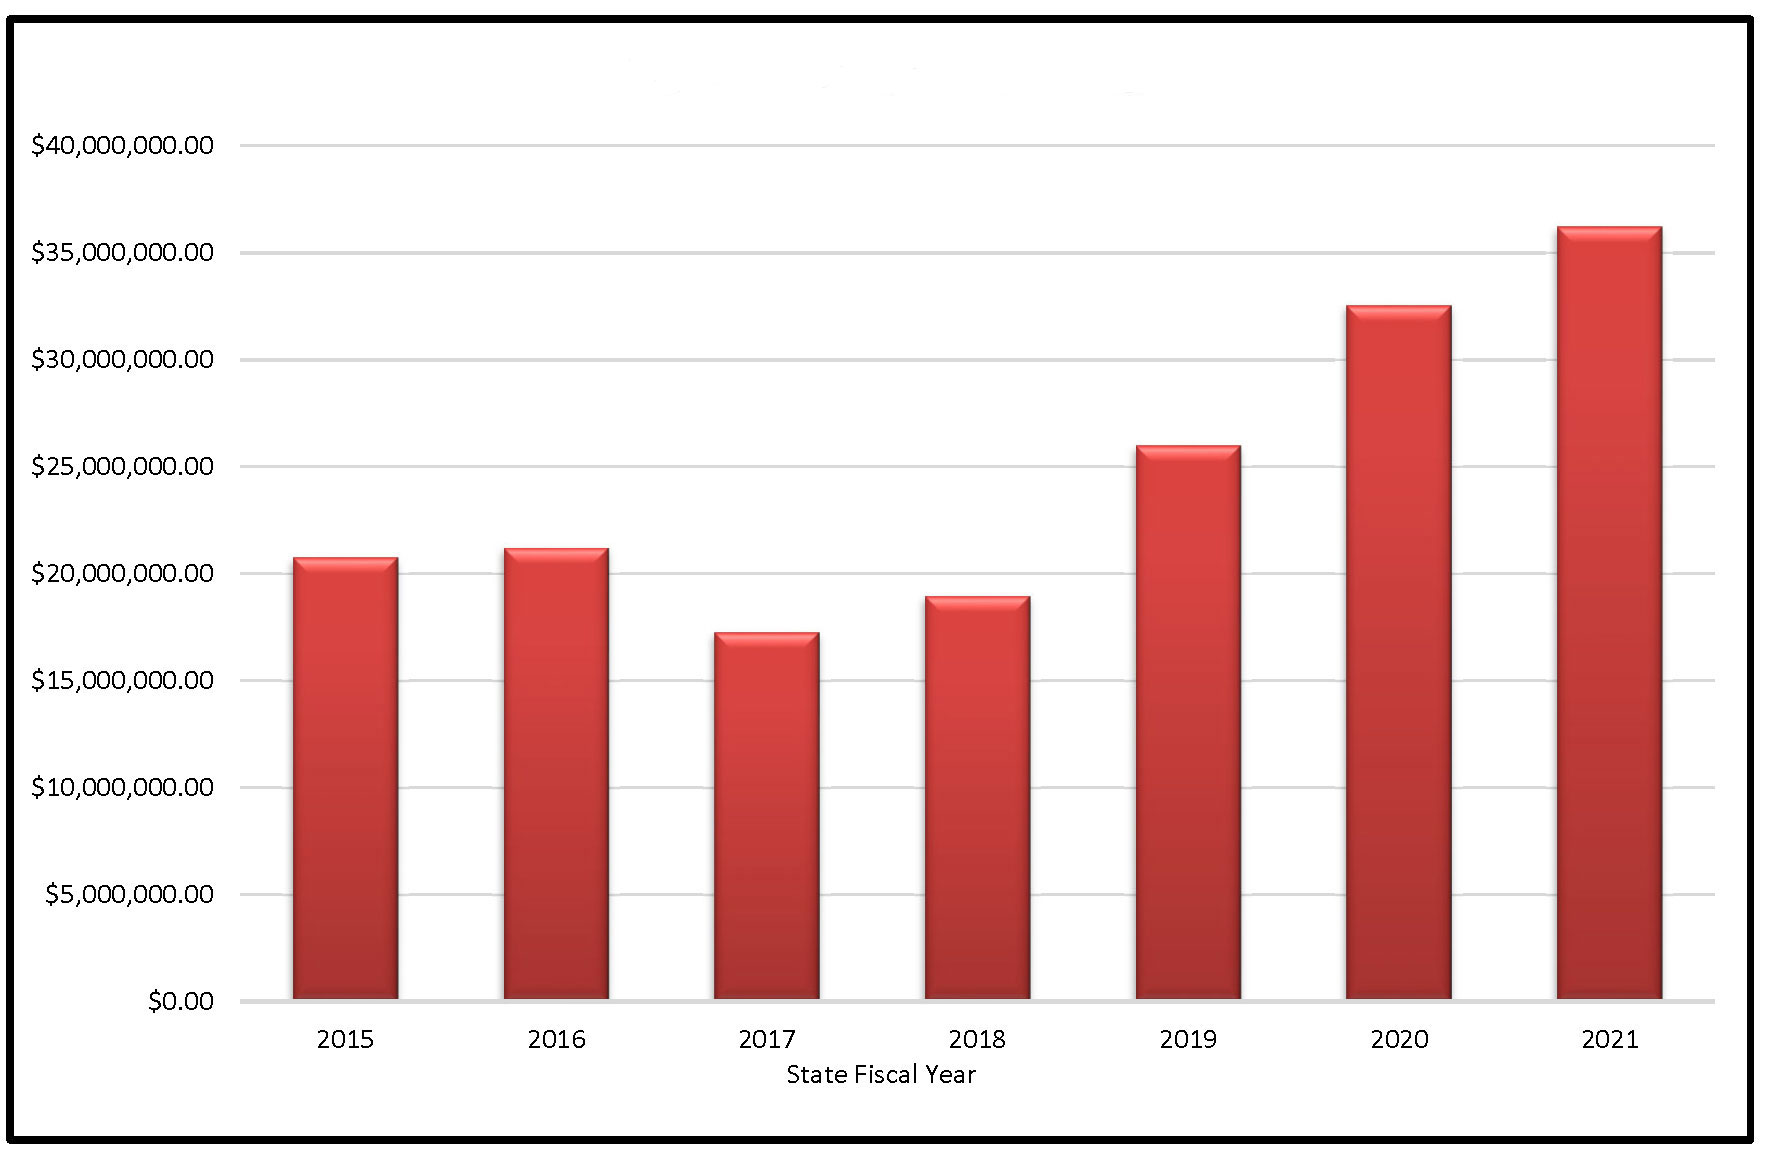
Key notes and observations:
- Values are all payments made to professional services consultants (Design, Inspections, Construction Support, Public Involvement, etc.)
- Includes payments made through Project Contracts as well as Term Contracts
Annual PE & OT Expenditures Combined
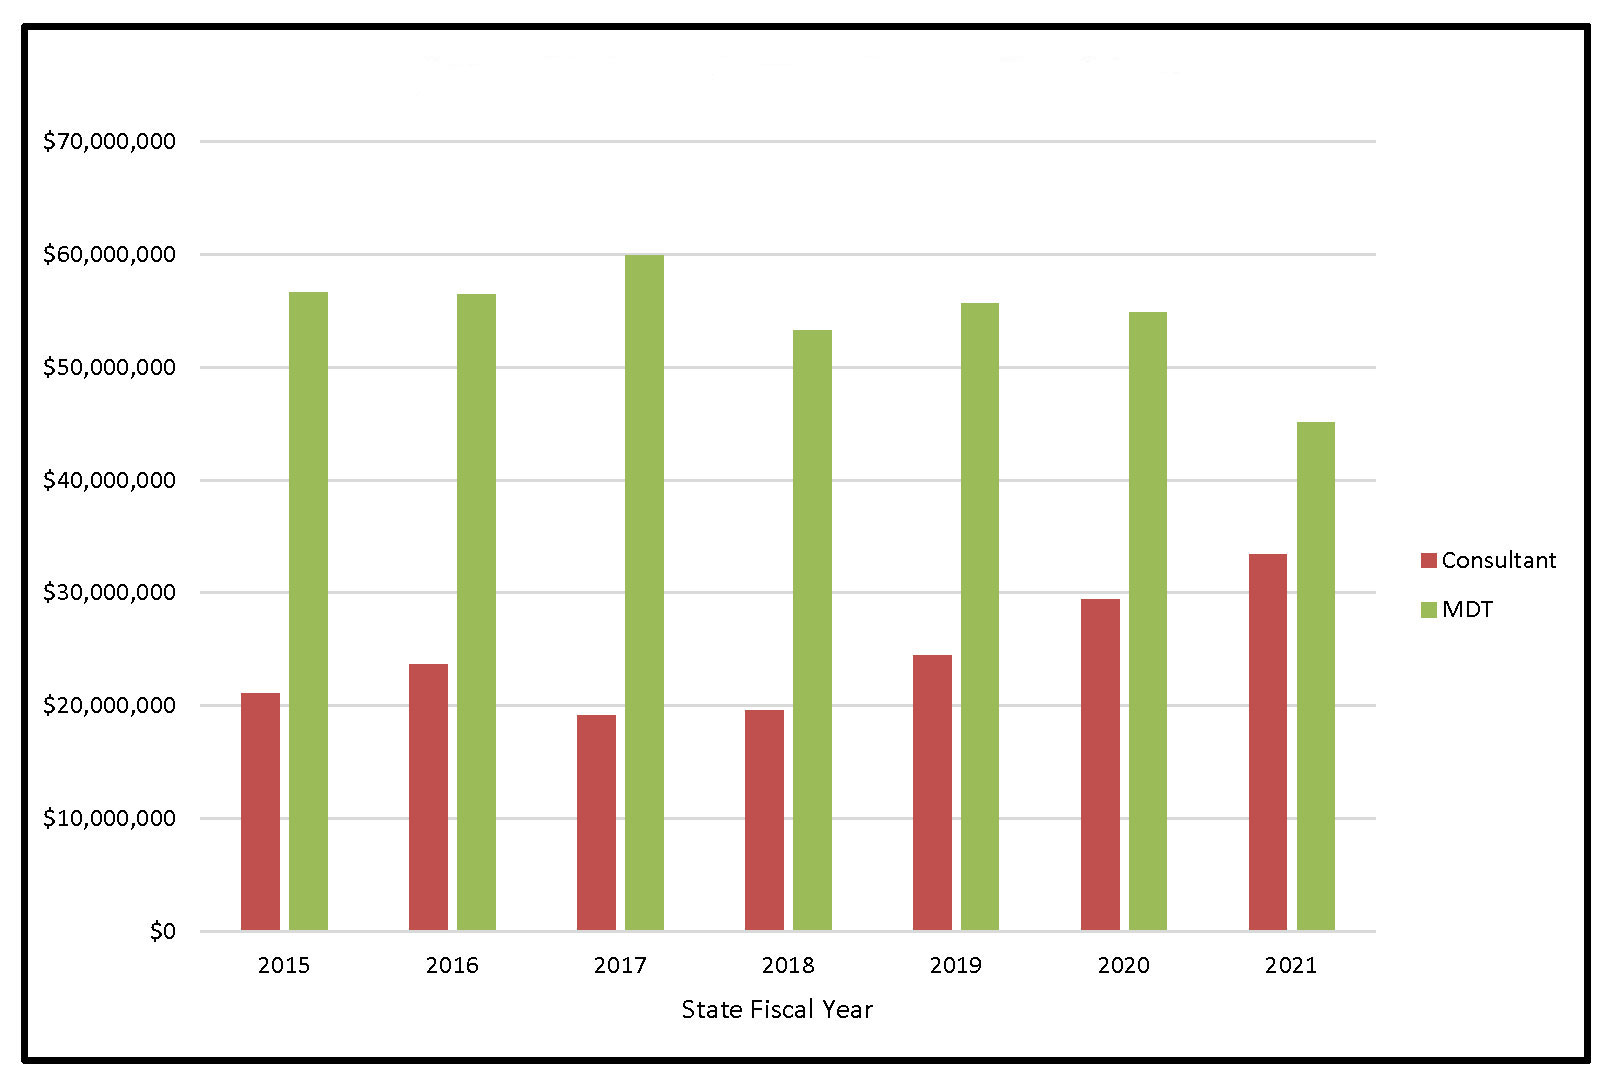
Key notes and observations:
- Values expressed in this chart are expenditures incurred primarily for Studies, Preliminary Engineering/Project Development, and Bridge Inspection/Load Rating
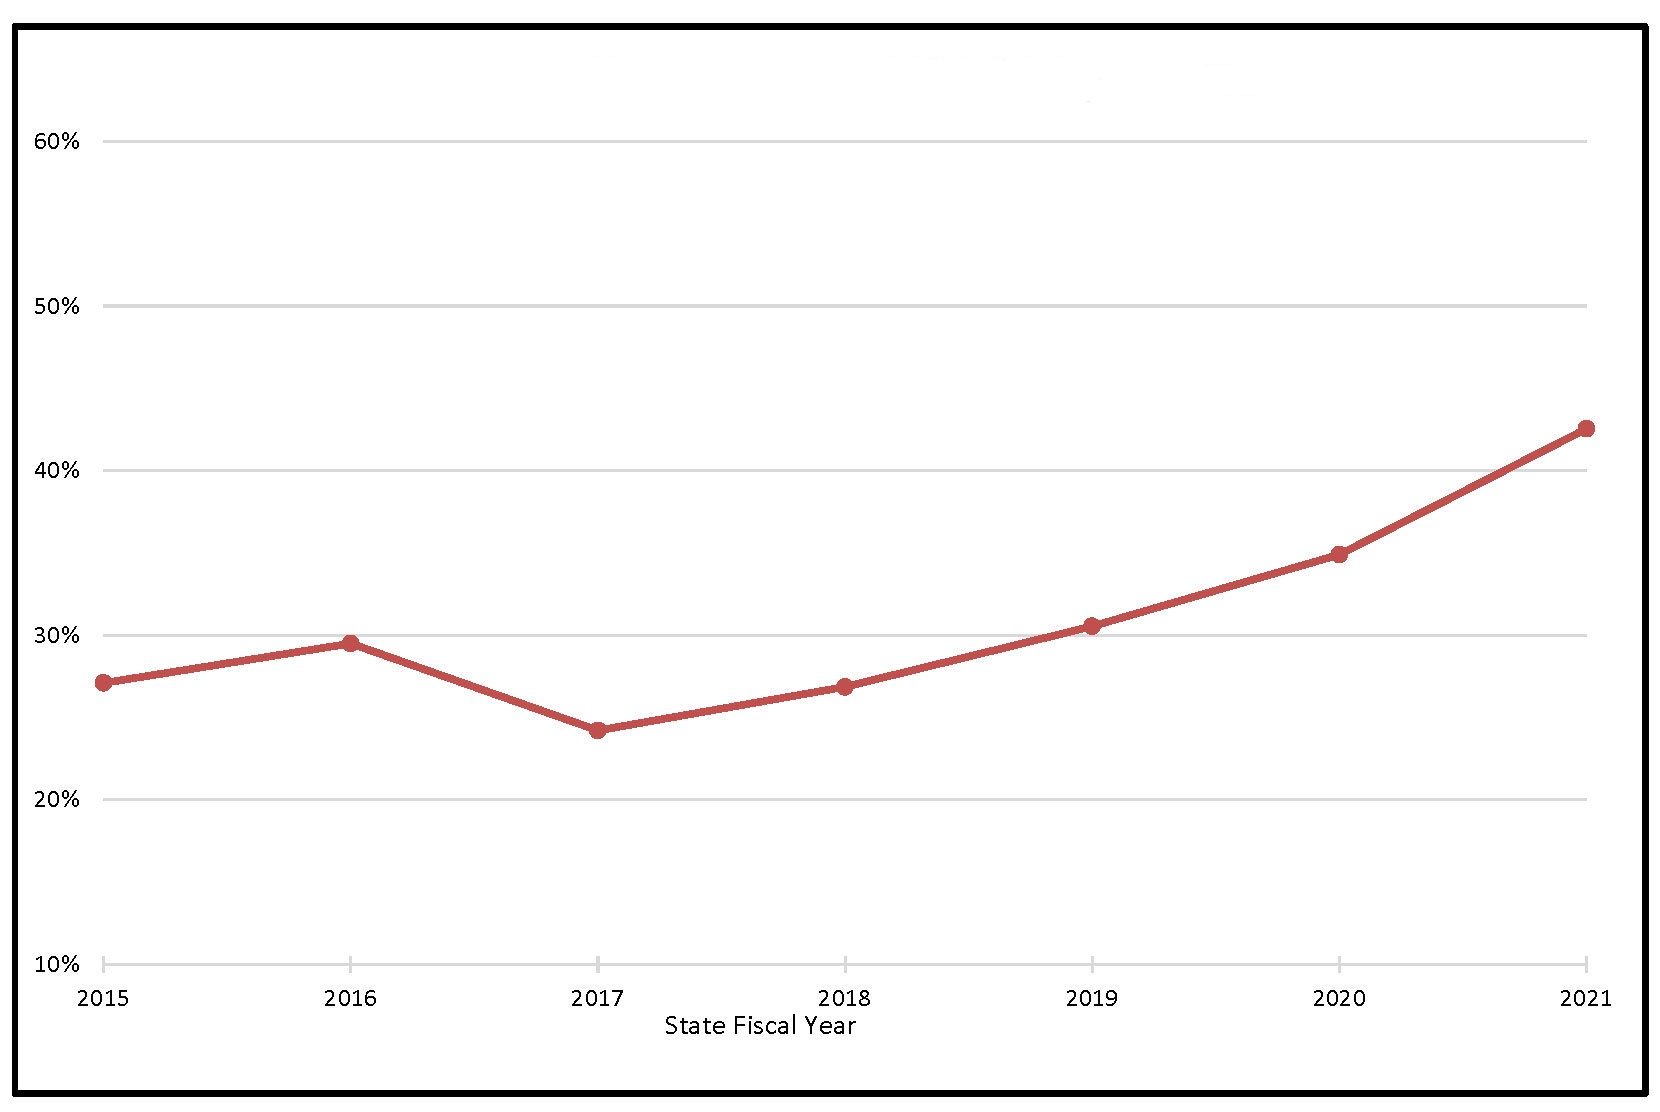
Consultant Share of Annual OT/PE Expenditures
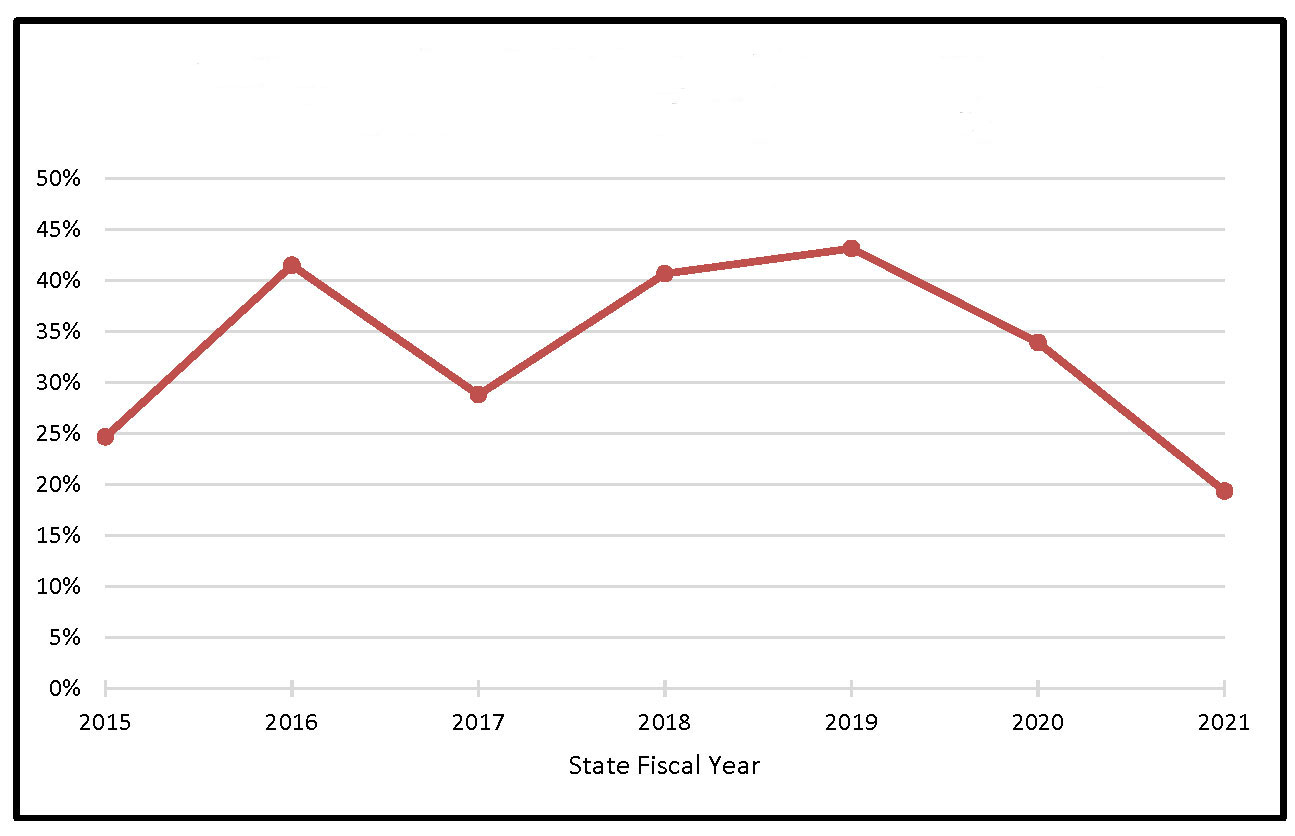
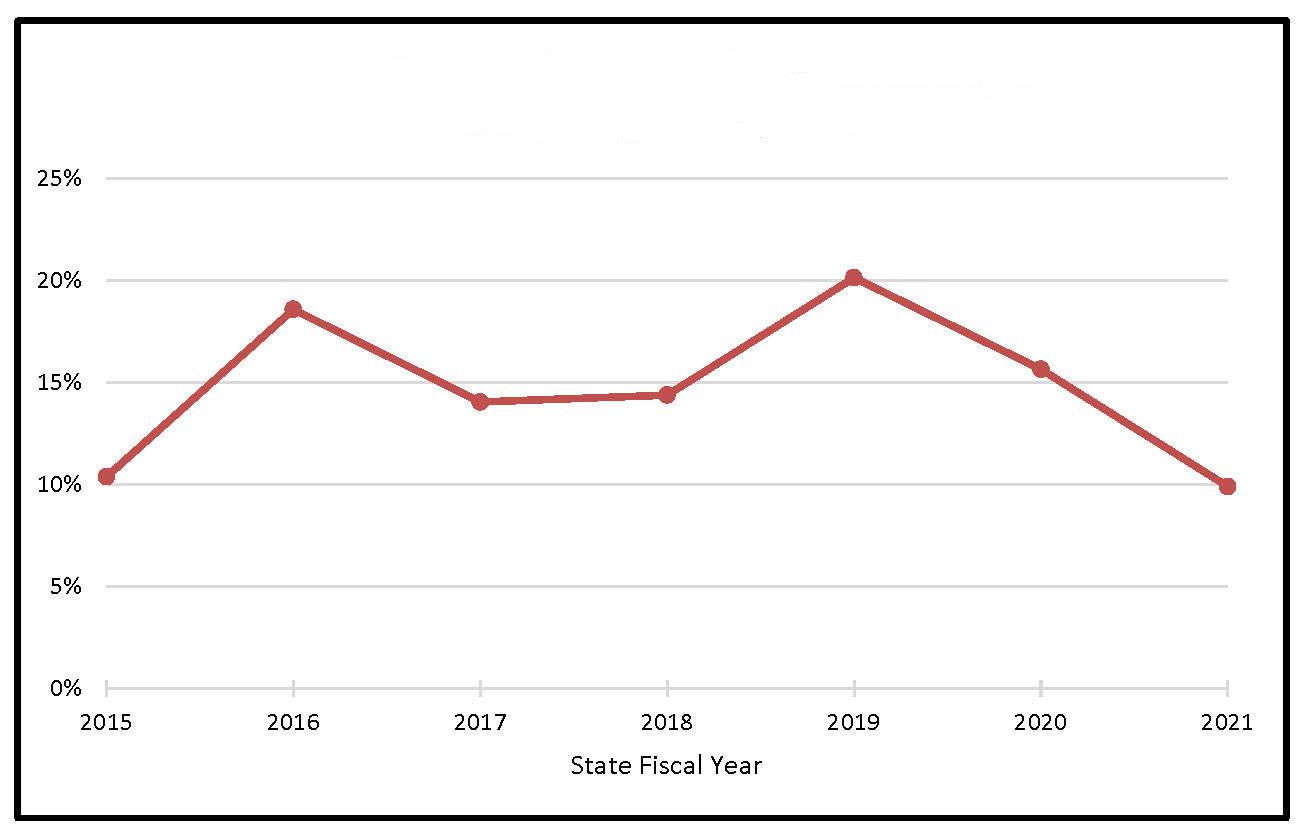
Percentage of the Number of Projects Awarded to Construction (Design led by Consultants)
Percentage of the Dollar Value of Projects Awarded to Construction (Design led by Consultants)