

What is sketch planning?
Sketch planning tools are used to produce general order-of-magnitude estimates of transportation and land use demand and impacts. These tools are generally easier to implement and less costly than sophisticated software packages used to conduct in-depth engineering analysis. Often, they are spreadsheet-based or GIS-based techniques that apply the similar concepts to aggregated or generalized data. Because of their flexibility, these tools are often developed by agency staff or consultants for a specific project.
Sketch planning is often used as an alternative to developing complex travel demand models for forecasting future travel demand. These may be spreadsheet-based or GIS-based. In either case, the spreadsheet, or GIS program, is used to simulate and forecast future traffic flows.
A spreadsheet-based post-processor can work in conjunction with a travel demand model to estimate traffic on local roadways, forecast traffic patterns and diversion for smaller-scale development proposals, and identify travel markets that may be ripe for transit and non-motorized travel.
Who implements sketch planning?
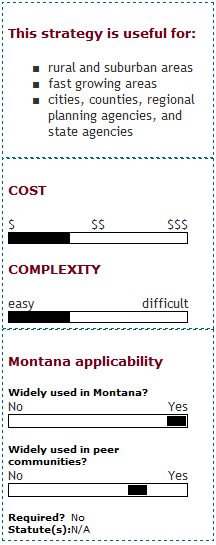
Rural and growing areas are most likely to apply sketch-planning software tools or methodologies as opposed to complex travel demand models. Development and implementation of a spreadsheet - or GIS-based travel demand models is far less costly and time-consuming than development of a traditional four-step travel demand model. The required software is more widely available and level of expertise and input data needed to develop and maintain such a model is substantially lower.
Simplified development and application of these tools for impact analysis are possible by using transferable parameters from national guides such as the ITE Trip Generation Manual and NCHRP Report 365.
What are the keys to success and potential pitfalls?
Sketch planning can be a cost-effective alternative to purchasing expensive, complex, and data intensive software packages. However it is important to keep in mind that estimates provided by sketch planning tools are generalized and dependent on the data aggregation and other assumptions that were made.
Where has this strategy been applied?
Examples in Montana
- Beaverhead County Growth Model: A GIS-based growth model that imitates the residential growth patterns that have evolved over the years in rural, amenity-rich areas throughout the West was used in Beaverhead County to visualize future development and travel patterns.
Examples outside of Montana
- Lacey, WA Traffic Atlas: The City of Lacey, Washington created a "traffic atlas" in which trips are generated from each Traffic Analysis Zone (TAZ) and a traffic distribution map is created for each TAZ. The city computes traffic generation for a project on request and a table is generated showing how many trips impact each project. No consultant is required and the proponent receives the tabulation of project traffic mitigation fees in one week or less.
Case studies
How can I get started?
Identifying the appropriate parameters and input data needed is the first step in developing a sketch planning tool. For example, to estimate changes in transit ridership, necessary data would include total demand, mode choice parameters, and transit travel times. Similarly, growth factors are needed to develop a sketch-planning growth model.